PropAMM Weekly · Ethereum
Edition 5 · POL Finance · week of 2026-10-10 to 2026-10-16.
We track the on-chain PropAMM landscape on Ethereum week by week. Unless noted, every figure comes from the router's own indexed data. This edition covers 6.9 days, from 2026-10-10 00:00 UTC to 2026-10-16 20:41 UTC, and compares them with the 7 days before.
The Uniswap V3 fallback filled 14.6% of router swaps this week (387 of 2,659), up from 7.9% the week before: for about one order in seven, no PropAMM maker met the required output. The move tracks FermiSwap, whose router volume fell 19% ($34.8M to $28.3M) and whose share of settled volume dropped from 86% to 72%.
Short version: the router settled $39.0M across 2,659 swaps in 6.9 days; per day, volume was down 1.5% and swaps down 1.7% against the previous week. FermiSwap's share fell from 86% to 72% as Tempest resumed full-week settlement, Metric settled on the router again from 2026-10-15, and Goliath appeared for the first time. The fallback rate rose to 14.6% from 7.9%, most of it on 2026-10-15 and 2026-10-16. CoW Protocol was the largest source of flow at $17.8M, 46% of the week's volume. Titan built 65% of the volume, up from 56%, with BuilderNet down to 25%.
1. The week on the router
| metric | this week (6.9 days) | previous week (7.0 days) | all-time to 2026-10-16 |
|---|---|---|---|
| window length | 6.9 days | 7.0 days | since 2026-06-01 |
| USD volume (window total) | $39.0M | $40.4M | $697.3M |
| USD volume per day | $5.69M | $5.77M | n/a |
| swaps (window total) | 2,659 | 2,759 | 62,080 |
| swaps per day | 388 | 394 | n/a |
| new accounts | +72 | +58 | 1,739 total |
| direct swaps | 1 (0.04%) | 2 (0.07%) | 517 (0.8%) |
| Uniswap V3 fallback rate (by swap count) | 14.6% | 7.9% | 18.2% |
| fees collected | $0.00 | $0.00 | $0.29 (47 charges) |
| maker state-update transactions | 9,461 | 5,385 | n/a |
Volume and swap count both fell slightly. The two windows differ in length, so we compare per day.
- Per day, volume fell 1.5% and swaps fell 1.7%. The window totals moved -3.4% and -3.6%.
- The fallback rate nearly doubled: a maker met the required output on 85.4% of orders, against 92.1% the week before. Most of the increase was late in the week: fallback was 8-13% of daily swaps through 2026-10-14, then 25.7% on 10-15 and 26.2% on 10-16.
- Daily volume ran $3.0M to $9.9M, lowest on 2026-10-14 ($3.0M) and highest on 2026-10-15 ($9.9M). The 2026-10-16 figure ($3.2M) is partial, to 20:41 UTC.
- There was 1 direct swap, on 2026-10-12, about $1. The data counts gas only on direct swaps, so the week's gas total, 0.0000377 ETH, is the gas of that one swap.
- The on-chain update registry carried 9,461 state-update transactions, 1,379 a day, up 79% from 769. Makers wrote 5.9 updates per swap, against 2.0.
Scale: the router settled $39.0M this week. Ethereum DEX spot volume was $8.10B over the trailing 7 days (DefiLlama, 2026-10-16), so the router is about 0.5% of on-chain swap volume. PropAMMs as a class were $570M over pamm.wtf's trailing 7 days, about 7% of that Ethereum DEX figure, within the 5-10% range reported by the ethresear.ch PropAMM post. The router is about 7% of the PropAMM class.
Where the change came from
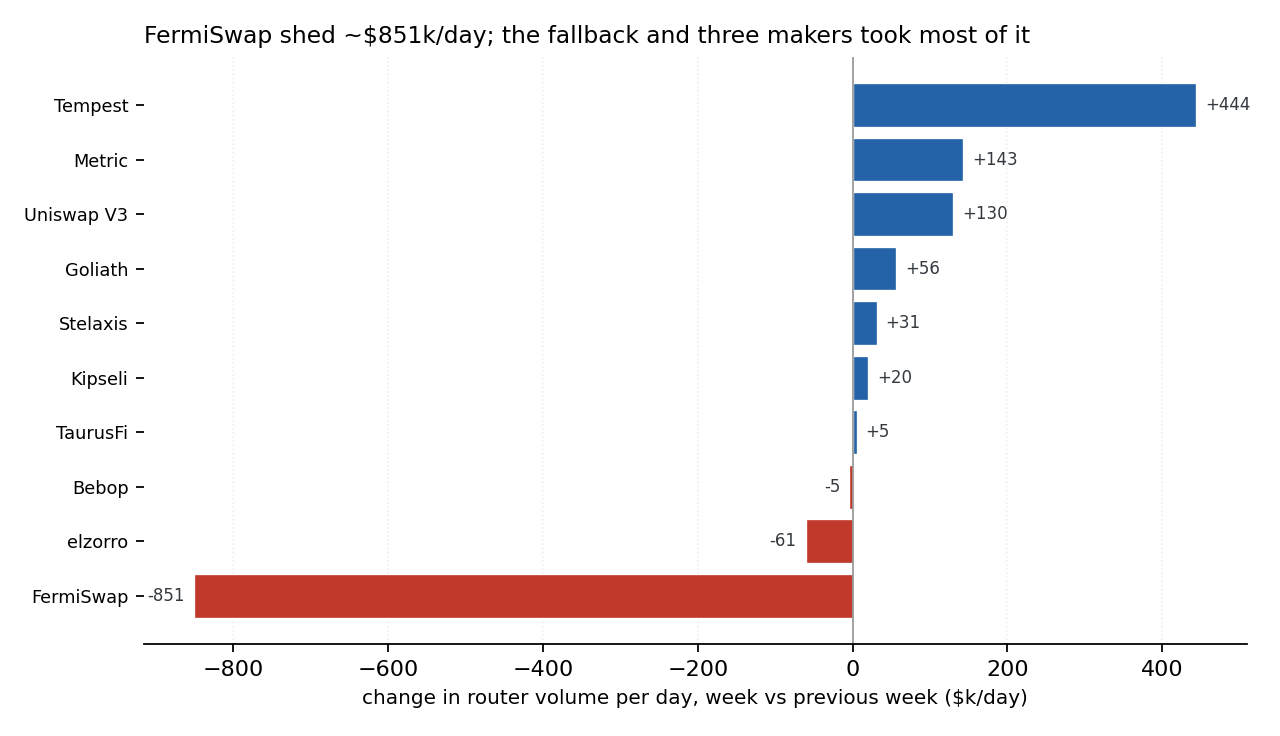
FermiSwap gave up volume; the fallback and three makers that were absent or thin a week ago took most of it.
| cause | router volume change per day |
|---|---|
| FermiSwap's router volume fell 19% ($34.8M to $28.3M); share 86% to 72% | -$851k |
| Tempest resumed full-week settlement (20 to 405 swaps) | +$444k |
| Metric settled on the router again (66 swaps, from 2026-10-15) | +$143k |
| Uniswap V3 fallback | +$130k |
| Goliath (first week on the router, from 2026-10-13) | +$56k |
| Stelaxis | +$31k |
| Kipseli | +$20k |
| elzorro | -$61k |
| Bebop | -$5k |
| TaurusFi | +$5k |
How we split it: router volume per day fell $86k (-1.5%). Each row is that maker's router volume per day this week minus the previous week.
2. Who is winning the flow
Ranked by USD volume settled this week.
| maker | USD volume | swaps | week share | previous week share |
|---|---|---|---|---|
| FermiSwap | $28.3M | 940 | 72% | 86% |
| Uniswap V3 (fallback) | $3.5M | 387 | 9% | 7% |
| Tempest | $3.3M | 405 | 8% | <1% |
| Kipseli | $1.1M | 133 | 3% | 2% |
| Metric | $0.98M | 66 | 3% | 0% |
| Stelaxis | $0.84M | 270 | 2% | 2% |
| Bebop | $0.41M | 79 | 1% | 1% |
| Goliath | $0.39M | 105 | 1% | 0% |
| elzorro | $0.19M | 207 | <1% | 2% |
| TaurusFi | $0.05M | 67 | <1% | <1% |
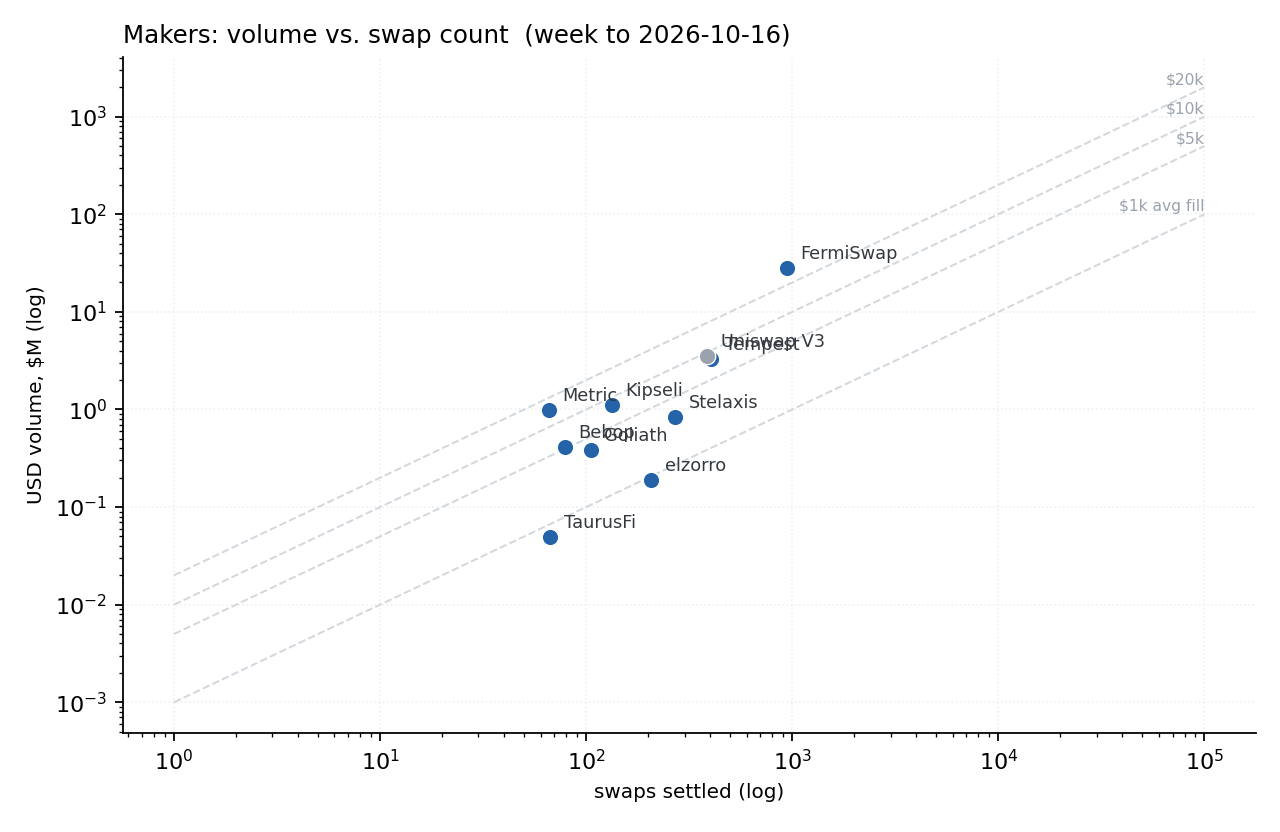
FermiSwap's router volume fell 19% on 26% fewer swaps (1,265 to 940); its average fill rose from $27.5k to $30.1k. Tempest returned to full-week settlement after filling only 20 swaps the week before. Metric and Goliath did not settle on the router last week.
In the chart, the diagonals mark constant average fill.
3. Concentration
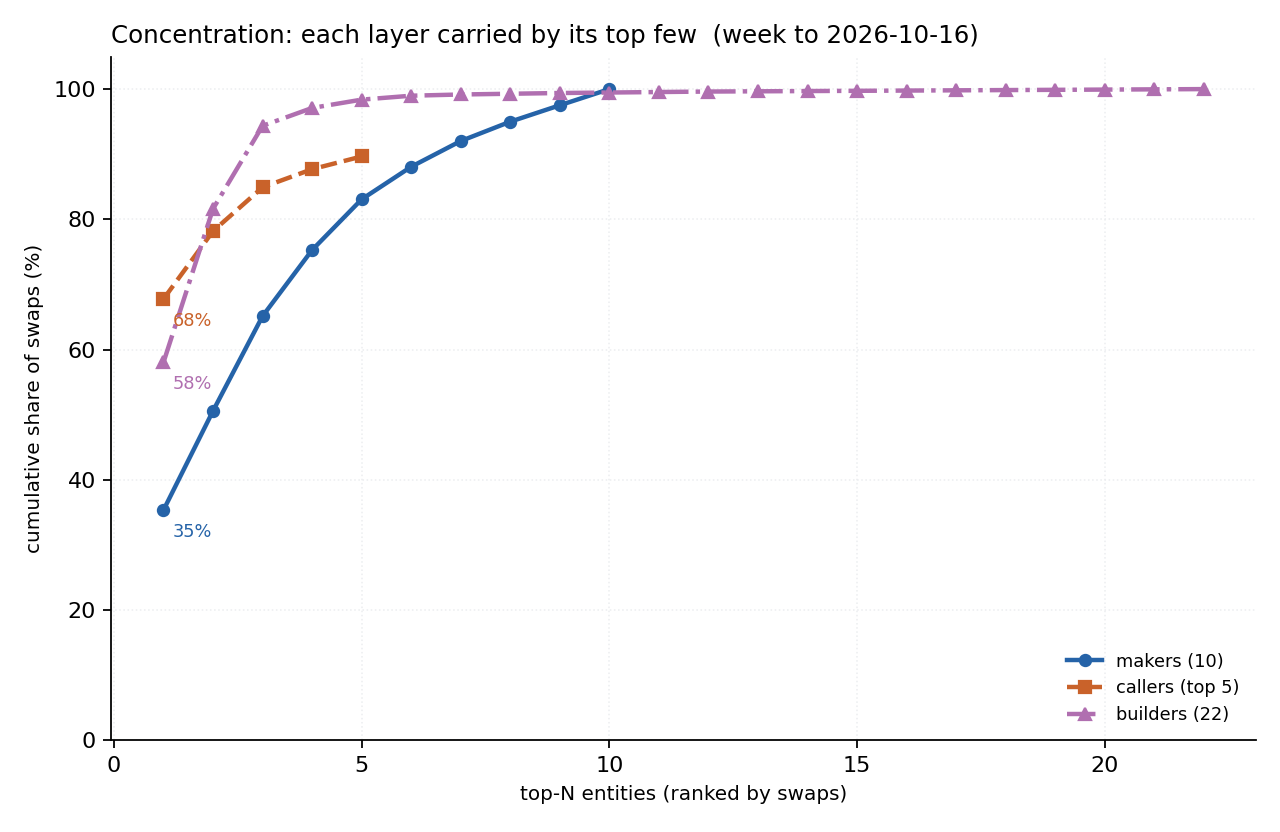
Maker flow spread out; builder flow concentrated further onto Titan. We use the Herfindahl-Hirschman Index (HHI), the sum of squared percentage shares, on a 0 to 10,000 scale.
| HHI (by USD volume) | this week | previous week |
|---|---|---|
| makers | 5,421 | 7,470 |
| builders | 4,920 | 4,381 |
- Top maker share fell from 86% to 72%; the top three makers went from 95% to 90% of volume. Maker HHI fell about 2,050 points.
- Top builder share rose from 56% to 65%; the top two builders held 90% of volume in both weeks, with the split shifting toward Titan. Builder HHI rose about 540 points.
- By swap count the same direction holds: maker HHI fell (2,954 to 1,919), builder HHI rose (3,885 to 4,096).
The fall in maker concentration is the same event as the fallback and the returning makers in section 1: FermiSwap's share went to the fallback venue and to Tempest, Metric and Goliath.
4. Maker markout
This section is from pamm.wtf's 7-day leaderboards, which cover all callers across each venue's own pools, not the router alone. Values there are taker-perspective; we sign-flip them to the maker. Positive means the maker keeps value (the fill was priced in the maker's favor); negative means the taker gains. t0 is the fill instant, t10 and t60 are 10 and 60 seconds later. PnL per $1M is the venue's cumulative markout over the 7 days divided by its volume.
| maker | 7d swaps | 7d volume | maker median markout, bp (t0 / t10 / t60) | t60 P5 / P95 (bp) | maker PnL per $1M (t0 / t60) |
|---|---|---|---|---|---|
| FermiSwap | 13,839 | $328.7M | +0.56 / +0.49 / +0.23 | -10.65 / +12.11 | +$39 / +$85 |
| Metric | 15,705 | $183.9M | +0.11 / +0.09 / +0.03 | -7.26 / +7.26 | +$14 / +$5 |
| Kipseli | 3,066 | $16.1M | +0.94 / +1.06 / +1.37 | -10.65 / +13.76 | +$100 / +$139 |
| Tempest | 3,278 | $12.9M | +0.80 / +0.64 / +0.64 | -10.65 / +12.11 | +$73 / +$86 |
| Goliath | 4,116 | $11.0M | +0.16 / +0.38 / +0.49 | -10.65 / +13.76 | +$10 / +$138 |
| Stelaxis | 3,495 | $9.9M | +0.23 / +0.30 / +0.06 | -10.65 / +12.11 | +$15 / +$107 |
| elzorro | 3,201 | $4.1M | +0.64 / +0.56 / +0.23 | -9.37 / +10.65 | -$89 / -$114 |
| Bebop (bopAMM) | 1,240 | $2.9M | +0.91 / +0.91 / +0.91 | -12.52 / +14.23 | +$67 / +$146 |
| TaurusFi | 836 | $0.5M | +0.70 / +0.80 / +1.17 | -11.02 / +13.35 | +$55 / +$109 |
- Median maker markout at t0 is positive for every venue, from +0.11 bp (Metric) to +0.94 bp (Kipseli): the maker captures part of the spread on the median fill.
- Cumulative PnL per $1M is positive for every venue except elzorro, where it is -$89 at t0 and -$114 at t60: over pamm.wtf's 7 days, takers profited against elzorro.
- The t60 band is wide at every venue (P5 near -10 bp, P95 near +12 bp). Per-swap markout at 60 seconds is dominated by the subsequent price move, so the median, not the mean, describes the typical fill, and the mean-based PnL per $1M carries the tails.
5. Best and worst maker, and why
FermiSwap is the best maker on the router this week by dollars and swaps. Among the others, Tempest, Metric and Goliath all gained; elzorro fell and shows the only negative markout.
- FermiSwap leads with $28.3M on 940 swaps, average fill $30.1k, up from $27.5k.
- Tempest resumed full-week settlement: 405 swaps, $3.3M, from 20 swaps and $0.22M. It is now the third maker by volume.
- Metric settled on the router again: 66 swaps, $0.98M, all from 2026-10-15 13:53 UTC to 2026-10-16 19:09 UTC. Its previous router fill was on 2026-09-28. pamm.wtf shows Metric trading throughout the week off the router.
- Goliath settled on the router for the first time: 105 swaps, $0.39M, from 2026-10-13. It appeared on pamm.wtf from 2026-10-06.
- elzorro fell to 207 swaps and $0.19M, from 706 and $0.62M. On pamm.wtf's 7-day markout it is the only venue with negative cumulative maker PnL (section 4).
- TaurusFi settled 67 swaps, $0.05M.
6. Execution cost by trade size
Small trades pay mostly gas; large trades pay mostly price.
Cost is the swap's price against the Binance mid at the same second, plus gas, in bp of trade size. Positive means worse than the mid. We cover USDC/USDT and WETH against USDC or USDT.
Stable/stable (USDC/USDT)
| trade size | n | median price cost (bp) | median gas (bp) | median all-in (bp) | p25-p75 all-in (bp) |
|---|---|---|---|---|---|
| $1k-10k | 108 | 0.18 | 3.71 | 3.91 | 1.53 to 8.86 |
| $10k-50k | 27 | 0.20 | 0.34 | 0.66 | 0.46 to 1.77 |
| $50k-250k | 34 | 0.18 | 0.10 | 0.28 | 0.22 to 0.42 |
| $250k-1M | 9 | 0.20 | 0.03 | 0.24 | 0.14 to 0.31 |
USDC/USDT at $1M and above: 3 swaps this week, too few to report a cost.
ETH/stable (WETH/USDC, WETH/USDT)
| trade size | n | median price cost (bp) | median gas (bp) | median all-in (bp) | p25-p75 all-in (bp) |
|---|---|---|---|---|---|
| $1k-10k | 921 | 0.82 | 2.41 | 4.29 | 1.78 to 9.54 |
| $10k-50k | 396 | 0.85 | 0.33 | 1.48 | 0.80 to 2.93 |
| $50k-250k | 79 | 1.72 | 0.13 | 1.84 | 1.04 to 3.89 |
ETH/stable at $250k-1M: 3 swaps this week, too few; none at $1M and above.
Each column is a separate median across swaps, so price and gas medians do not add up to the all-in median.
What the tables show:
- Under $10k, gas is most of the cost on both classes.
- From $50k up, median gas is at or below 0.13 bp. Price is the larger part from $10k up on ETH/stable and from $250k up on USDC/USDT.
- USDC/USDT all-in is 0.28 bp at $50k-250k and 0.24 bp at $250k-1M (9 swaps).
- ETH/stable all-in is 1.84 bp at $50k-250k, 1.72 bp of it price. The $250k-1M bucket holds only 3 swaps and is not reported.
Coverage: we measure 1,580 of the week's 2,659 swaps. Excluded:
- 907 swaps under $1k (782 ETH/stable, 65 stable/stable, 60 other).
- 171 swaps of $1k or more in WBTC and cbBTC pairs (154 and 16), and 1 UNI swap.
- 1 swap this week had no USD price (a WBTC/cbBTC trade).
7. What is trading
USDT carried the dollars this week; USDC carried more of the count. ETH carried the swap count.
- USDT: about $13.3M traded across 1,246 swaps.
- USDC: about $12.6M across 1,658 swaps.
- WETH: the most-traded token by count at 2,181 swaps.
- WBTC present at 215 swaps, up from 136; cbBTC marginal at 17.
Top pairs by USD volume:
- USDC/USDT: $12.9M on 246 swaps, near $52k a trade, against 131 swaps near $107k the week before. The swap count nearly doubled and the average trade roughly halved.
- USDT/WETH: $11.3M on 901 swaps, ahead of USDC/WETH by dollars.
- USDC/WETH: $10.7M on 1,280 swaps.
8. Who is sending the orders
The same two callers lead. CoW Protocol was the largest by volume; one integrator sent two-thirds of the swaps.
| caller | swaps | USD volume |
|---|---|---|
| 0x9008…ab41 (CoW Protocol) | 277 | $17.8M |
| 0x9c2e…c48c | 1,802 | $10.2M |
| 0xdd86…a8a6 | 27 | $1.5M |
| 0x34d7…b793 | 25 | $1.3M |
| 0xa530…cea7 | 19 | $0.91M |
- CoW Protocol settlement: 46% of the week's volume on 277 swaps. Edition 4 published CoW at 57% for 2026-10-03 to 2026-10-09, a different window cut, so this is not a clean week-over-week.
- The integrator 0x9c2e: 68% of the week's swaps (1,802), averaging near $5.6k.
- 86 distinct callers sent orders, against 72.
- In the concentration chart, the top caller holds 68% of swaps.
9. Where the blocks are built
| builder | swaps | USD volume | week share |
|---|---|---|---|
| Titan | 1,543 | $25.5M | 65% |
| BuilderNet | 627 | $9.6M | 25% |
| Quasar | 339 | $2.0M | 5% |
| Eureka | 73 | $0.60M | 2% |
| builder.ultrasound.money | 3 | $0.45M | 1% |
| Builder+ (btcs.com) | 16 | $0.43M | 1% |
| bombora.build | 34 | $0.26M | <1% |
Titan built more of the volume than last week; BuilderNet built less.
- Titan: 65%, from 56% the previous week, averaging near $16.6k a swap.
- BuilderNet: 25%, from 35%, averaging near $15.3k.
- Quasar fell from 6% to 5%; Eureka from 2% to 2%.
- Eureka's swaps are almost all fallback: 72 of 73. Titan built 127 fallback swaps of 1,543.
- 22 builders built at least one router swap, against 11 the week before, most of them one or two fallback swaps each.
10. Today vs where it is heading
Forward-looking and hedged; separate from the data above.
What changed this week is the maker mix, not the size of the router: volume held near $39M while FermiSwap gave up 14 points of share to the fallback and to three makers that were absent or thin a week ago. The fallback rate doubled, and most of that increase landed on 2026-10-15 and 2026-10-16 (25-26% of daily swaps), the same days Metric re-entered; whether that is a transient or a new baseline is not distinguishable from one week. If the returning makers hold their quotes, maker concentration (HHI 5,421, down from 7,470) should keep falling; if they pull back as Tempest and Metric did in earlier weeks, the fallback share is the number to watch. The on-chain update registry carried 9,461 transactions this week, up 79% a day, which we keep tracking as the router's own gas footprint.
11. Sources and method
Data and windows
- The router's data API, read-only, for 2026-10-10 00:00 UTC to 2026-10-16 20:40:59 UTC (6.862 days). Last swap 20:39 UTC. No swap reverted.
- Previous week: the same API for 2026-10-03 00:00 to 2026-10-10 00:00 UTC (2,759 swaps, $40.42M), a full 7-day cut. Every change in this edition is against it. Edition 4 published a Friday-21:00 cut of the same week (2,726 swaps, $40.04M); the two cuts are not mixed. The difference, 33 swaps and $0.37M, is the 2026-10-09 21:00 to 2026-10-10 00:00 tail.
- All-time: no fresh database dump was pulled this edition. All-time is edition 4's published all-time to 2026-10-09 21:00 UTC ($657.9M, 59,388 swaps) plus that tail (33 swaps, $0.37M, 5 fallback) plus this week, giving $697.3M and 62,080 swaps. Fallback 11,298 (18.2%), direct 517, accounts 1,739.
- USD volume is priced on the stablecoin leg, a lower bound. 1 swap this week was unpriced (a WBTC/cbBTC trade).
- Token dollar figures give half of each swap's USD value to each token.
- Callers are the address that called the router. Only CoW Protocol is labeled. No caller table was pulled for the previous week.
- The data's gas totals count direct swaps only (1 this week). Section 6 uses each swap's transaction gas.
- Maker update counts: the router's on-chain update registry, indexed through each window.
Market figures, markout and execution cost
- Ethereum DEX scale: DefiLlama dex overview for Ethereum, trailing-7-day volume $8.10B, pulled 2026-10-16.
- PropAMM-class volume and per-maker markout: pamm.wtf public leaderboards, 7-day lookback to 2026-10-16, with pamm.wtf's own USD pricing. These cover all callers across each venue's own pools, not the router. Leaderboard values are taker-perspective; we sign-flip them to the maker (percentile order reverses). Maker PnL per $1M is the venue's cumulative taker PnL over the 7 days, negated, divided by its 7-day volume.
- The "PropAMMs are about 5-10% of Ethereum swap volume" figure is from the ethresear.ch PropAMM post and pamm.wtf, not our own measurement.
- Binance mid: from public aggTrades (USDCUSDT, ETHUSDC, ETHUSDT), the average of the last buyer- and seller-initiated trade from 60 seconds before the block to the end of its second (600 seconds for 13 of 1,580 swaps).
- Gas: transaction gas cost times the ETHUSDT 1-second close, split pro-rata by USD value across router swaps in the same transaction. In-transaction builder payments are excluded.