PropAMM Weekly · Ethereum
Edition 3 · POL Finance · week of 2026-09-25 to 2026-10-02.
We track the on-chain PropAMM landscape on Ethereum week by week. Unless noted, every figure comes from the router's own indexed data. This edition covers the 7.3 days since edition 2.
Short version: the router settled $40.6M across 3,325 swaps in 7.3 days; per day, volume was down 55% and swaps down 29% against edition 2's 10.9-day window. FermiSwap took 75% of the week's volume while Metric's volume fell 90%, from $39.4M to $3.9M. CoW Protocol was again the largest source of flow at $20.4M, half of the week's volume. The Uniswap V3 fallback fired on 8.2% of swaps, down from 11.5%. Titan built 59% of the volume, with BuilderNet up to 27%.
1. The week on the router
| metric | this week (7.3 days) | edition 2 week (10.9 days) | all-time to 2026-10-02 |
|---|---|---|---|
| window length | 7.3 days | 10.9 days | since 2026-06-01 |
| USD volume (window total) | $40.6M | $135.2M | $617.2M |
| USD volume per day | $5.6M | $12.4M | n/a |
| swaps (window total) | 3,325 | 7,023 | 56,603 |
| swaps per day | 456 | 643 | n/a |
| new accounts | +67 | +280 | 1,608 total |
| direct swaps | 0 (0.0%) | 13 (0.2%) | 514 (0.9%) |
| Uniswap V3 fallback rate (by swap count) | 8.2% | 11.5% | 18.9% |
| fees collected | $0.00 | $0.00 | $0.29 (47 charges) |
Activity fell, and the whole propAMM market fell with it. The two windows differ in length, so we compare per day.
- Per day, volume fell 55% and swaps fell 29%. The window totals fell 70% and 53%.
- Across all Ethereum propAMMs, volume per day fell 47% ($75.2M to $39.5M, pamm.wtf), or 33% excluding Metric.
- The fallback rate dropped again: a maker met the required output on 91.8% of orders.
- There were no direct swaps.
Where the drop came from
Most of the drop comes from the makers' own volume, not from the router losing share.
| cause | router volume change per day | share of the drop |
|---|---|---|
| Metric stopped filling (last fill on the router 2026-09-28 19:53 UTC) | -$3.07M | 45.0% |
| FermiSwap's total volume fell 28%, mostly outside stable pairs | -$1.96M | 28.8% |
| The router's share of FermiSwap's flow fell from 14.6% to 11.9% | -$0.93M | 13.6% |
| Other makers | -$0.86M | 12.6% |
How we split it: router volume per day fell $6.82M. Maker totals include direct fills, measured on-chain. For FermiSwap, edition 2's router share applies to the change in total volume, and this week's total to the change in share.
2. Who is winning the flow
Ranked by USD volume settled this week.
| maker | USD volume | swaps | week share | edition 2 share |
|---|---|---|---|---|
| FermiSwap | $30.5M | 1,271 | 75% | 57% |
| Metric | $3.9M | 136 | 10% | 29% |
| Uniswap V3 (fallback) | $2.1M | 273 | 5% | 9% |
| Tempest | $1.7M | 631 | 4% | 2% |
| Kipseli | $1.1M | 151 | 3% | 2% |
| elzorro | $0.82M | 772 | 2% | <1% |
| Bebop | $0.31M | 67 | <1% | <1% |
| Stelaxis | $0.02M | 24 | <1% | new |
| TaurusFi | $0.00M | 0 | 0% | <1% |
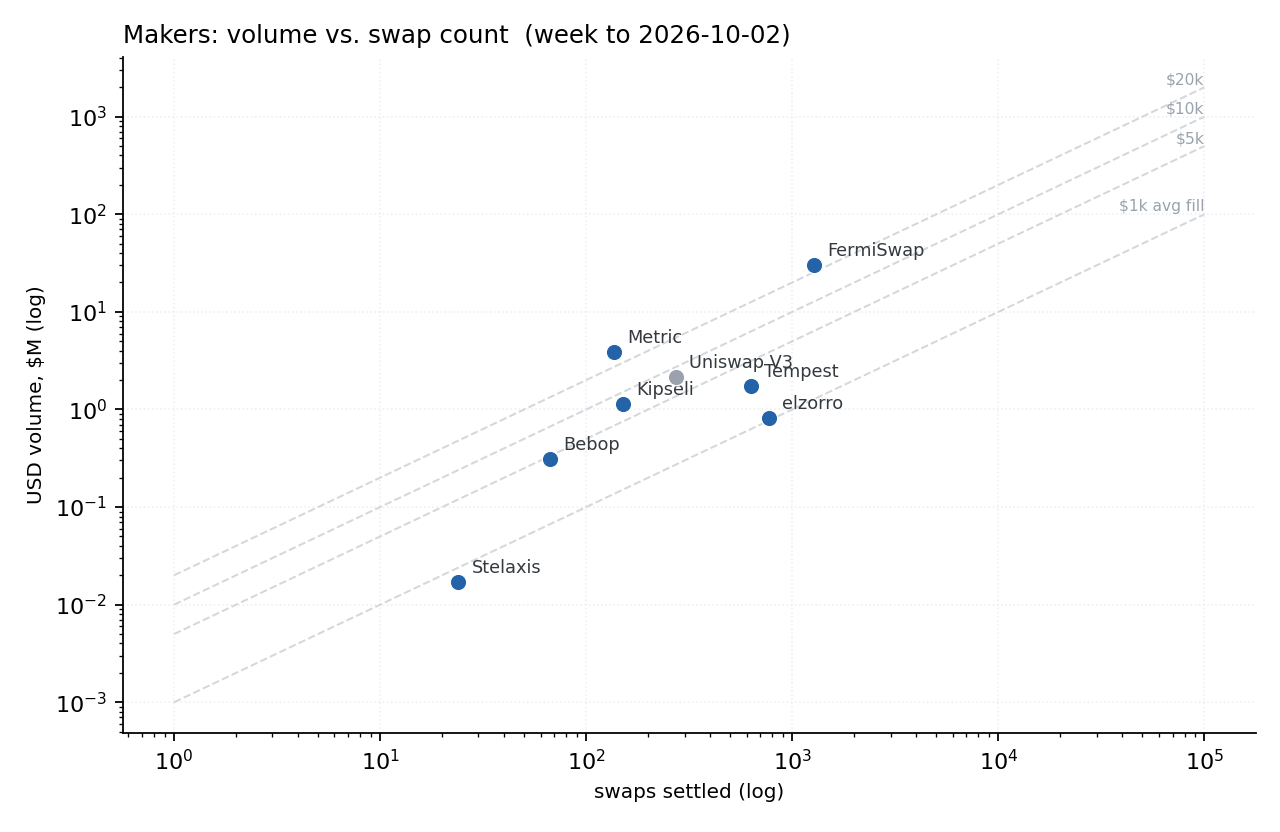
FermiSwap's share rose because Metric fell, not because FermiSwap grew: its own volume fell 61% ($77.3M to $30.5M), against 70% for the router.
In the chart, the diagonals mark constant average fill.
3. Best and worst maker, and why
FermiSwap is the best maker this week. Metric shows the largest decline.
- FermiSwap leads on dollars and swaps, with an average fill near $24.0k.
- Metric's average fill was larger, near $28.8k, on 136 swaps. Edition 2 had the reverse ($27.1k against $21.2k).
- Metric's swaps fell 93% and its volume 90%. It stopped filling on 2026-09-28 (section 1).
- Stelaxis settled its first swaps on the router: 24 swaps, $17.1k.
- TaurusFi settled no swaps.
- Bebop rose from 27 to 67 swaps, all through a Bebop contract address with no earlier fills on the router.
4. Execution cost by trade size
Small trades pay mostly gas; large trades pay mostly price.
Cost is the swap's price against the Binance mid at the same second, plus gas, in bp of trade size. Positive means worse than the mid. We cover USDC/USDT (the only stable pair this week) and WETH against USDC or USDT.
Stable/stable (USDC/USDT)
| trade size | n | median price cost (bp) | median gas (bp) | median all-in (bp) | p25-p75 all-in (bp) |
|---|---|---|---|---|---|
| $1k-10k | 153 | 0.14 | 5.48 | 5.62 | 1.18 to 17.45 |
| $10k-50k | 53 | 0.10 | 0.37 | 0.55 | 0.19 to 1.32 |
| $50k-250k | 49 | 0.07 | 0.05 | 0.13 | 0.06 to 0.29 |
| $250k-1M | 6 | 0.16 | 0.11 | 0.30 | 0.28 to 0.31 |
| $1M and above | 5 | 0.17 | 0.11 | 0.24 | 0.23 to 0.27 |
ETH/stable (WETH/USDC, WETH/USDT)
| trade size | n | median price cost (bp) | median gas (bp) | median all-in (bp) | p25-p75 all-in (bp) |
|---|---|---|---|---|---|
| $1k-10k | 1,091 | 0.55 | 5.38 | 7.05 | 2.60 to 18.34 |
| $10k-50k | 298 | 1.06 | 1.09 | 2.65 | 1.32 to 4.56 |
| $50k-250k | 85 | 1.44 | 0.33 | 2.01 | 1.31 to 3.44 |
ETH/stable above $250k: 4 swaps between $250k and $1M and none above $1M this week, too few to report a cost.
Each column is a separate median across swaps, so price and gas medians do not add up to the all-in median.
What the tables show:
- Under $10k, gas is most of the cost on both classes.
- From $50k up, median gas is at or below 0.33 bp and price is the larger part.
- USDC/USDT all-in stays between 0.13 and 0.30 bp from $50k up. The two largest buckets hold only 6 and 5 swaps.
Coverage: we measure 1,744 of the week's 3,325 swaps. Excluded:
- 1,463 swaps under $1k (1,265 ETH/stable, 105 stable/stable, 93 other).
- 11 swaps with no USD price.
- 107 swaps of $1k or more in WBTC and cbBTC pairs (92 and 15).
5. What is trading
Stablecoins carried the dollars and ETH carried the count. USDT moved ahead of USDC on both.
- USDT: about $15.7M traded across 2,050 swaps.
- USDC: about $13.2M across 1,635 swaps.
- WETH: the most-traded token by count at 2,753 swaps.
- WBTC present but thin at 184 swaps; cbBTC marginal at 18.
Top pairs by USD volume:
- USDC/USDT: $17.1M on 371 swaps, near $46k a trade.
- USDT/WETH: $12.6M on 1,560 swaps, now ahead of USDC/WETH.
- USDC/WETH: $8.1M on 1,183 swaps.
6. Who is sending the orders
The same two callers lead, and swap count is more concentrated than in edition 2.
| caller | swaps | USD volume |
|---|---|---|
| 0x9008…ab41 (CoW Protocol) | 191 | $20.4M |
| 0x9c2e…c48c | 2,637 | $13.5M |
| 0xb82a…97d4 | 45 | $1.6M |
| 0x824a…e0f5 | 18 | $1.1M |
| 0x147a…1e7f | 120 | $0.63M |
- CoW Protocol settlement: 50% of the week's volume, up from about 41%.
- The integrator 0x9c2e: 79% of the week's swaps, up from 47%, averaging near $5.1k.
- 81 distinct callers sent orders.
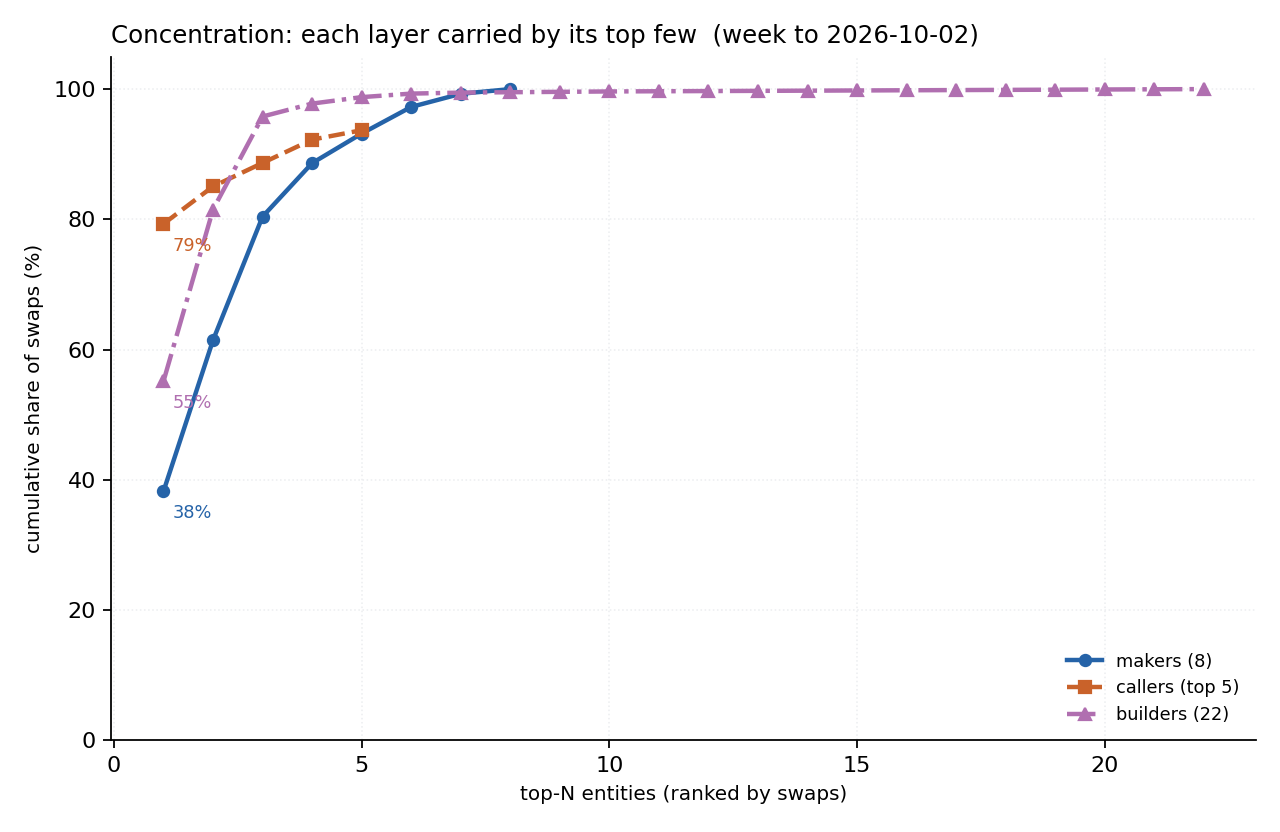
- In the concentration chart, the top builder holds 55% of swaps and the top maker 38%.
7. Where the blocks are built
| builder | swaps | USD volume | week share |
|---|---|---|---|
| Titan | 1,833 | $23.7M | 59% |
| BuilderNet | 877 | $11.1M | 27% |
| Quasar | 475 | $3.2M | 8% |
| bombora.build | 33 | $1.8M | 4% |
| Eureka | 66 | $0.49M | 1% |
Titan still builds most of the volume, but its share keeps slipping.
- Titan: 59%, from 64% in edition 2 and 69% all-time.
- BuilderNet rose from 18%; Quasar fell from 13%.
- bombora.build entered the top four, averaging near $53.9k a swap.
- Eureka's swaps are again almost all fallback: 62 of 66.
8. Sources and method
Data and windows
- The router's indexed database, current to 2026-10-02 20:08 UTC.
- USD volume is priced on the stablecoin leg, a lower bound. 11 swaps (10 AAVE/WETH, 1 WBTC/cbBTC) have no price and count as $0.
- Token dollar figures give half of each swap's USD value to each token.
- Callers are the address that called the router. Only CoW Protocol is labeled.
- We omit the maker update count: the registry table stops at 2026-09-15.
- This week: after edition 2's last swap (2026-09-25 13:04 UTC) to 2026-10-02 20:08 UTC. No swap reverted.
- Edition 2's figures, recomputed from this dump, match the published ones.
Drop attribution and execution cost
- Maker totals with direct fills: on-chain logs (eth_getLogs) on the FermiSwap and Metric contracts, all callers. The router-only FermiSwap volume from these logs matches the database.
- Market-wide figures: pamm.wtf public API, full days only.
- Binance mid: from public aggTrades (USDCUSDT, ETHUSDC, ETHUSDT), the average of the last buyer- and seller-initiated trade from 60 seconds before the block to the end of its second (600 seconds for 9 of 1,744 swaps).
- This is a trade-based proxy, not the book mid. On USDCUSDT it resolves to about 0.05 bp.
- Gas: transaction gas cost times the ETHUSDT 1-second close, split pro-rata by USD value across router swaps in the same transaction. In-transaction builder payments are excluded.